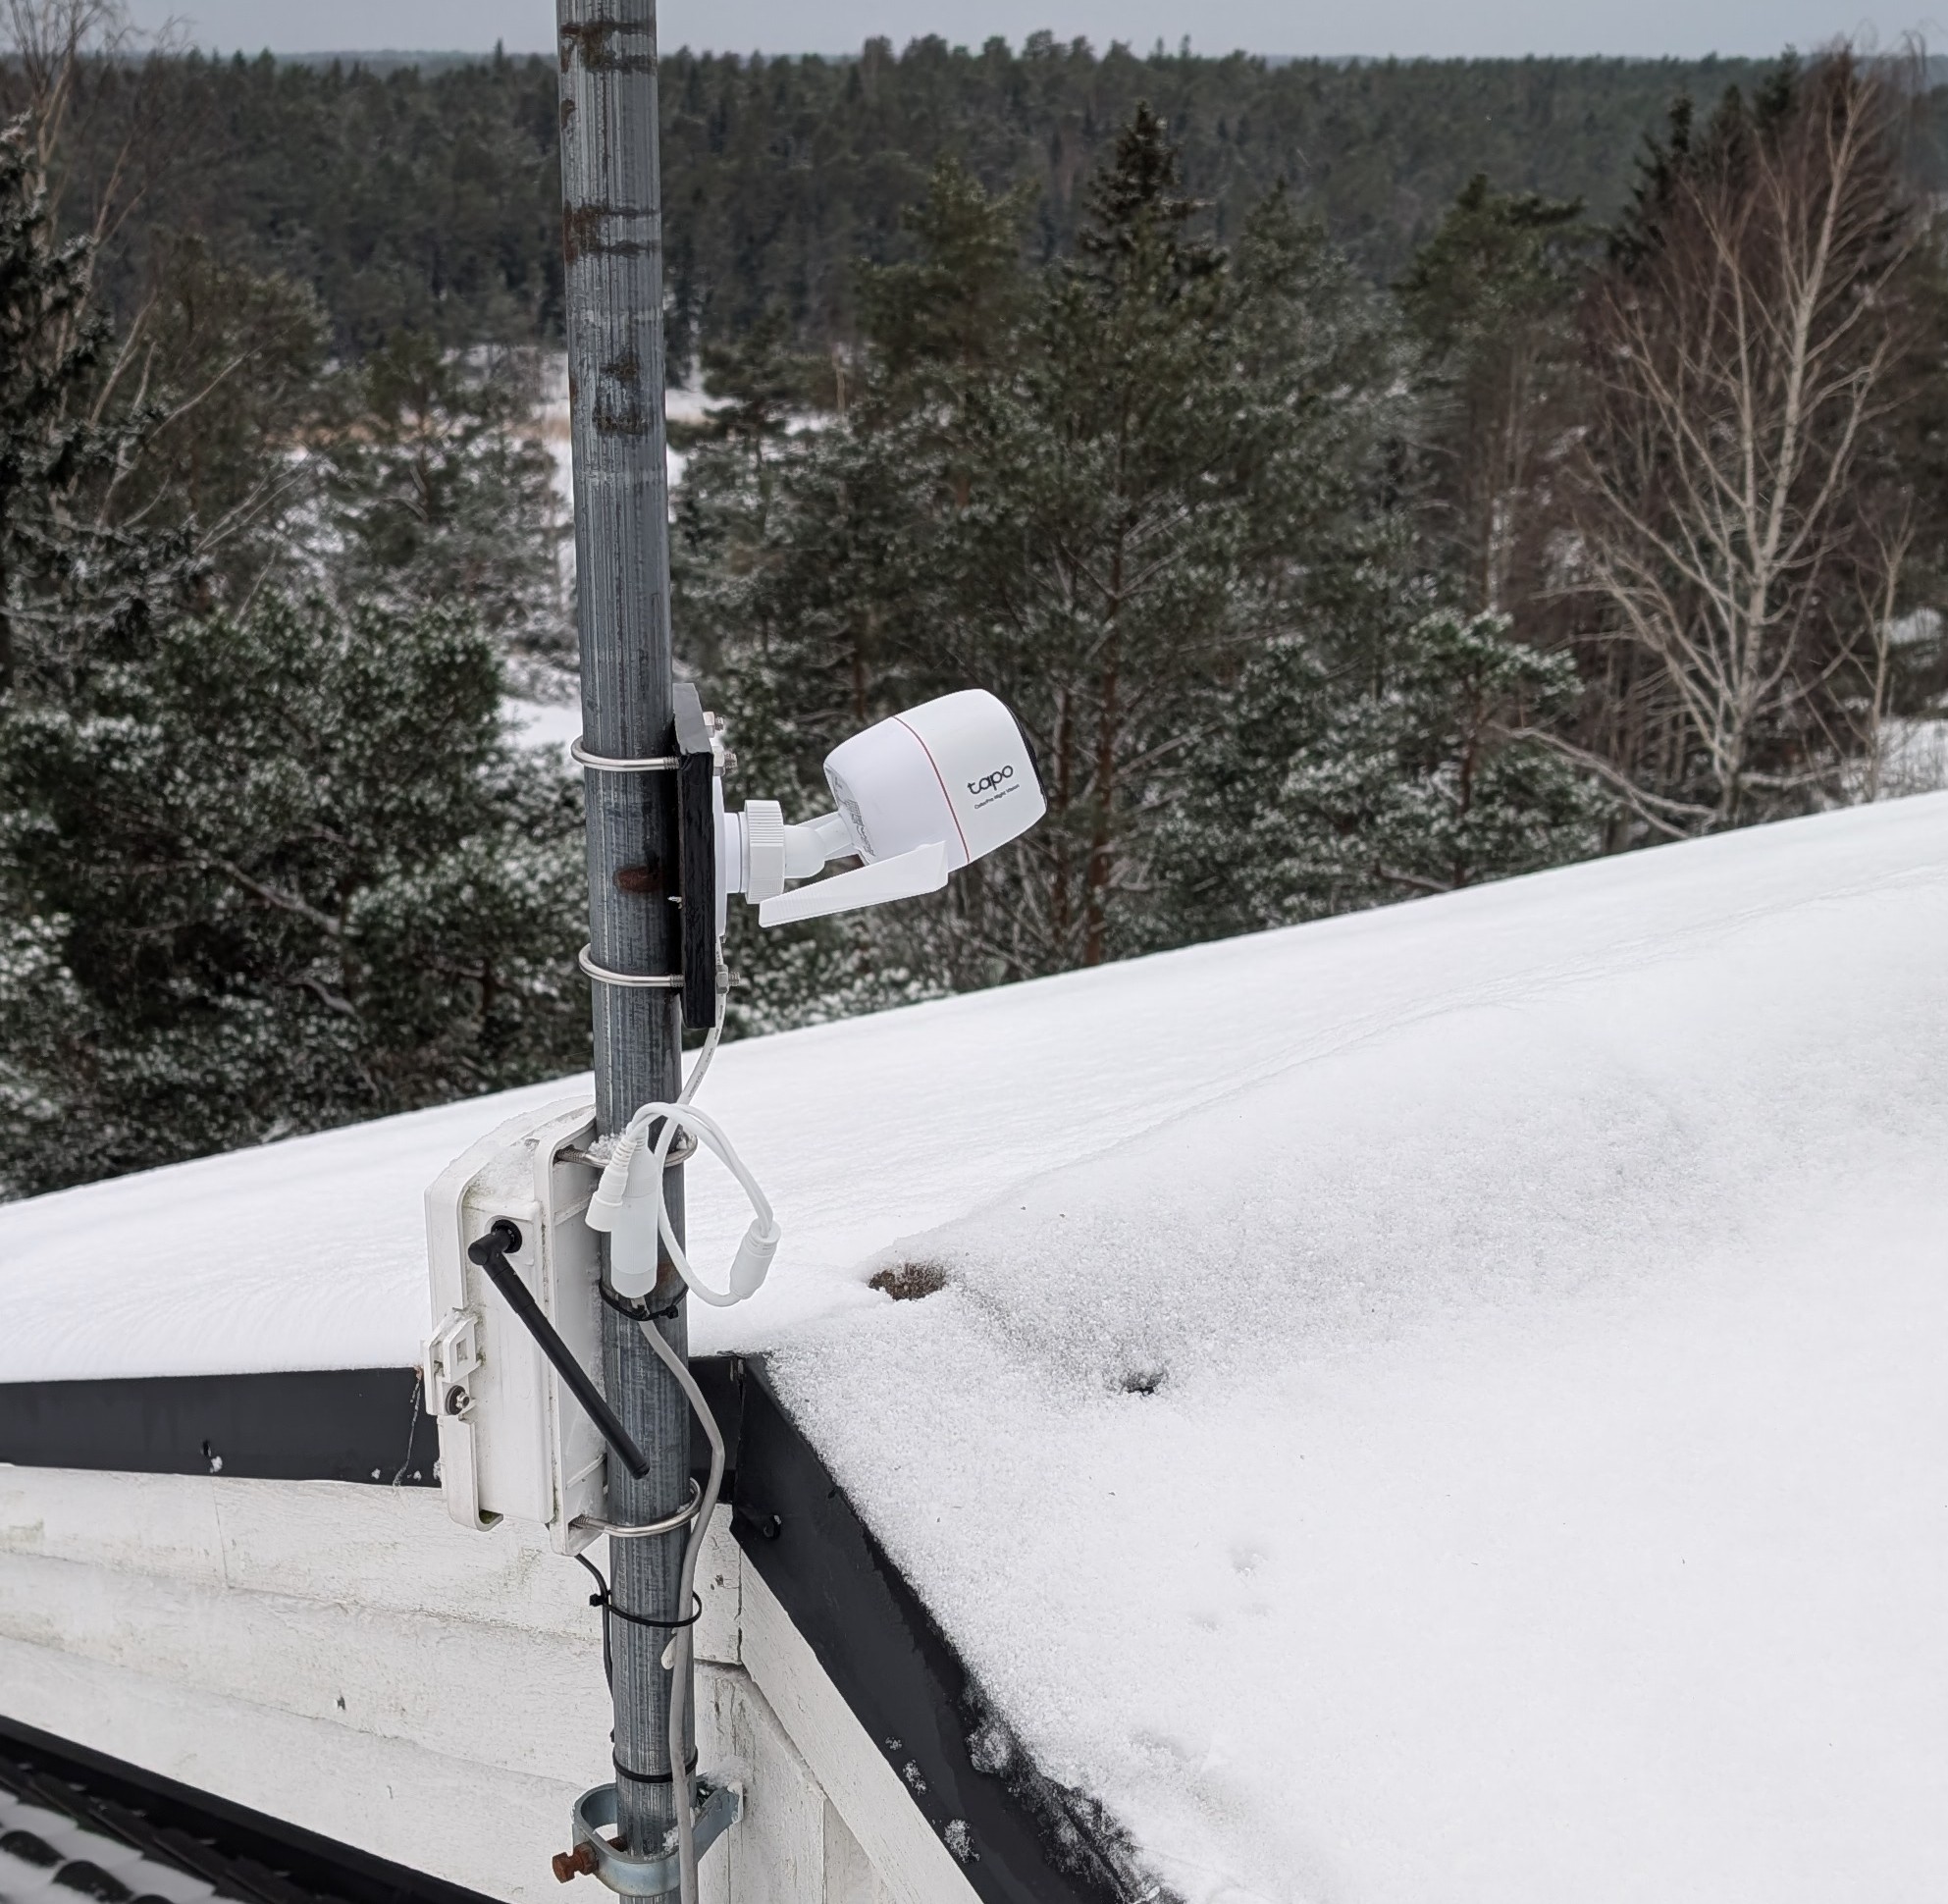
The new sky camera has been installed for some time now. So far, it has mostly captured cloudy scenes, but with high-pressure conditions prevailing, there have also been clear views. Under a cloudless night sky, the stars now stand out surprisingly clearly. In the image below, the Pleiades can be seen directly above the chimney.
The camera records video continuously, and an automatically generated 20× time-lapse video is also created. From these, it is possible to review what interesting events have occurred in the sky. I will publish interesting videos as they become available.
Two additional sky cameras are also on the way. Looking forward to observing exciting celestial events!
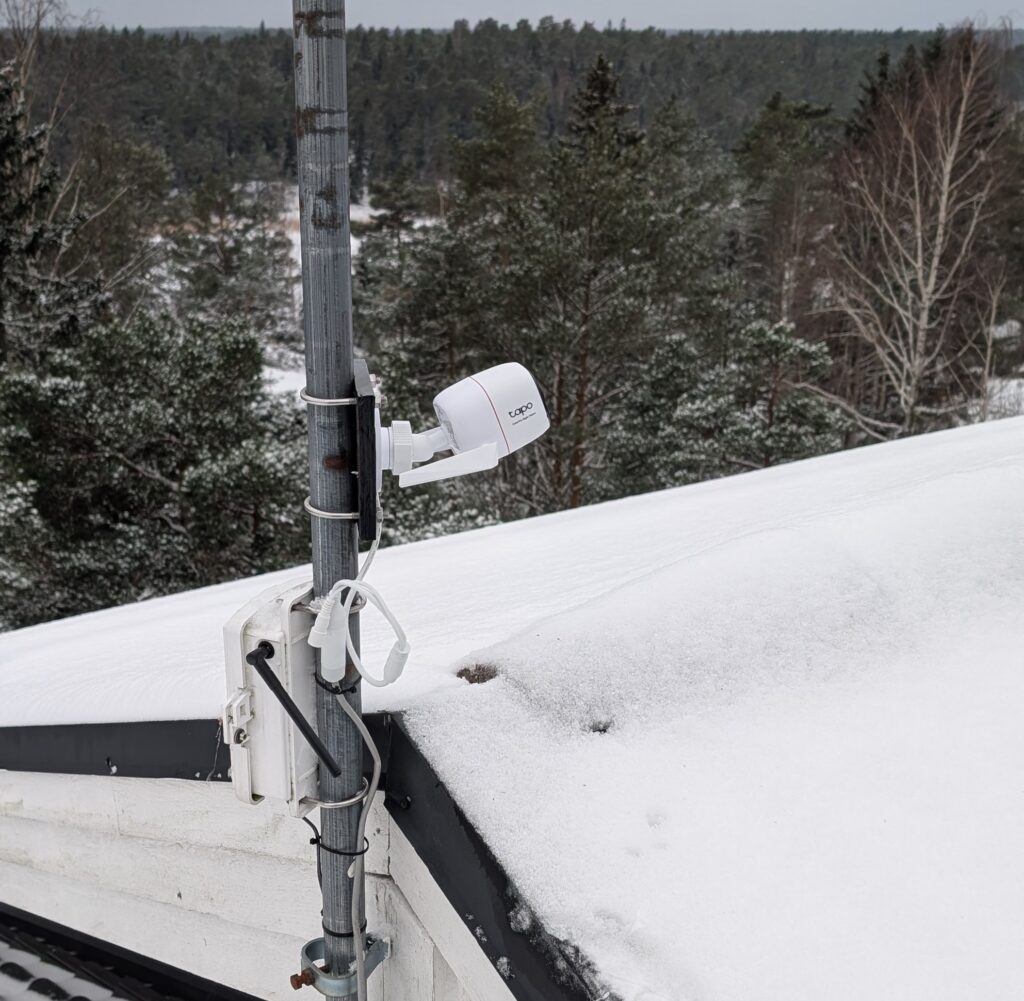
Weather Station Nagu now has a new weather camera, TP-Link Tapo C325WB. Compared with the previous one, the camera’s field of view is slightly wider, and it should be able to reproduce colors better even in low-light conditions.
The plan is to install a couple of additional sky-viewing cameras facing different directions. The project will move forward once the Station Master has been able to install more network cables on the roof.
This analysis was produced with the help of artificial intelligence, based on the weather data provided by the user.
Looking at the entire year, 2025 was notably mild and wet compared to earlier years.
The average temperature for 2025 was 8.1 °C, clearly higher than the long-term average of about 6.8 °C.
Total annual rainfall reached approximately 702 mm, which is well above the long-term annual average of around 465 mm.
Average humidity (83.9 %) was close to the historical norm, indicating that the increased rainfall did not significantly alter overall moisture levels.
Average wind speed (2.9 m/s) was slightly higher than average, and the maximum wind gust of 23.2 m/s was comparable to the strongest events in previous years.
📌 Notable anomalies in 2025
Exceptionally wet conditions, driven especially by autumn and early winter months (October–December).
A warmer-than-average year overall, consistent with recent trends toward milder conditions.
No extreme outliers in wind, but several months experienced strong gusts linked to storm systems.
🔎 Overall Assessment
The year 2025 as a whole stands out as warmer and significantly wetter than average, with precipitation totals far exceeding those of most earlier years. These findings suggest an increasingly variable and moisture-rich climate, particularly evident during the latter half of the year.
This analysis was produced with the help of artificial intelligence, based on the weather data provided by the user.
December 2025 marked a clear transition into winter conditions, with cold temperatures, high humidity, and increased windiness.
The average temperature for the month was 3.4 °C, while the highest temperature reached 7.8 °C. The lowest temperature dropped to –8.7 °C, indicating several distinctly cold days. Relative humidity remained high at an average of 89.9 %, consistent with frequent cloud cover and moist winter air. The average air pressure was relatively high at 1012 hPa, suggesting longer periods of stable winter high-pressure systems. Winds were more pronounced than in autumn: the average wind speed was 3.6 m/s, and the strongest gusts peaked at 23.2 m/s, pointing to a few intense winter storms.
💧 Rainfall in December
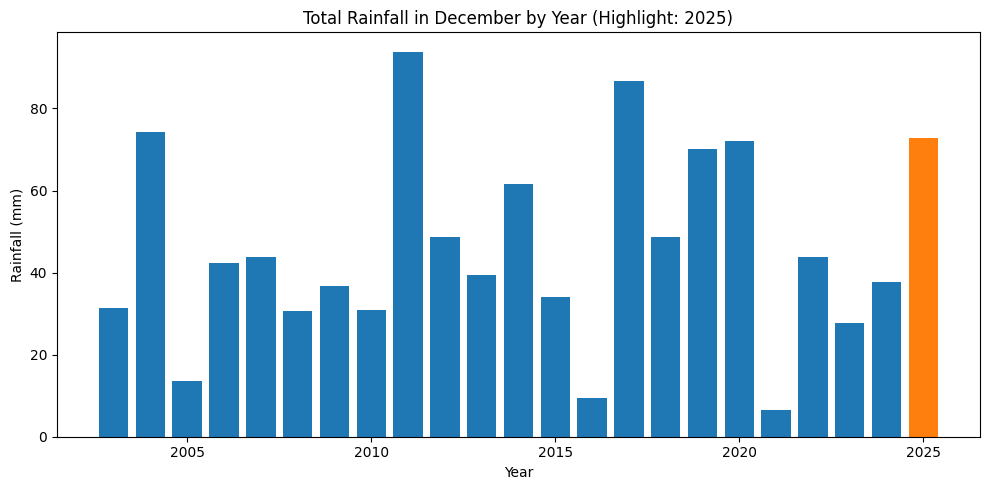
Total precipitation in December 2025 amounted to 72.8 mm. Compared to the long-term December average of about 46.0 mm, this makes December 2025 significantly wetter than usual. Much of the precipitation likely fell as rain or wet snow, reflecting temperatures that frequently hovered around freezing.
The chart above shows total December rainfall by year, with 2025 highlighted in orange. It clearly stands out as one of the wetter Decembers in the historical record, though not the absolute maximum.
This analysis was produced with the help of artificial intelligence, based on the weather data of Weather Station Nagu.
November 2025 was characterized by cool temperatures, high humidity, and moderate rainfall, consistent with late autumn weather conditions.
The average temperature was 5.0 °C, with the highest reading at 11.8 °C and the lowest dropping to –5.2 °C.
Average humidity was 90.8 %, suggesting persistently damp air and frequent cloud cover.
Average air pressure was 1007 hPa, indicating alternating low and high-pressure systems typical for November.
The average wind speed was 2.9 m/s, while the strongest gusts reached 22.4 m/s, pointing to a few stormy days.
💧 Rainfall Analysis
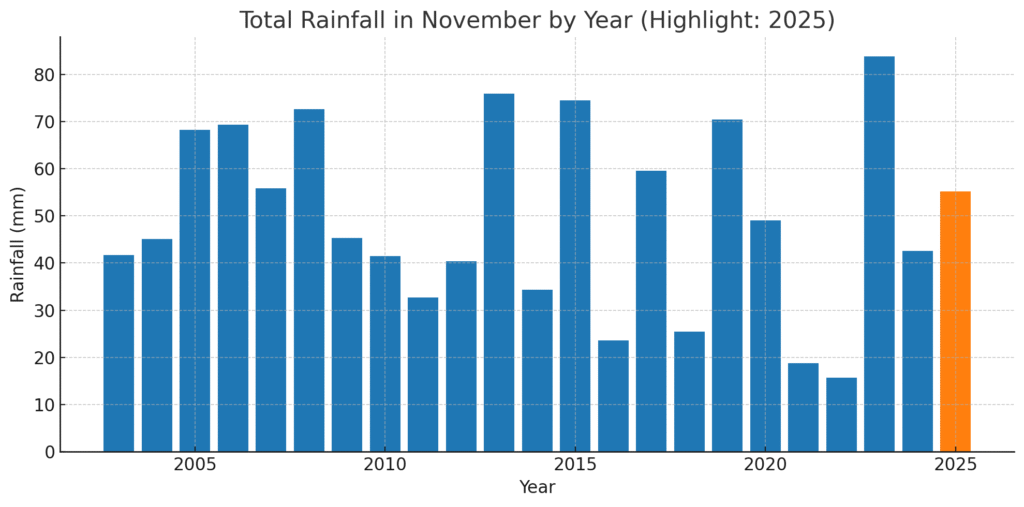
A total of 55.2 mm of rain was recorded in November 2025. Compared to the long-term average for November (≈49.6 mm), the month was slightly wetter than usual, though not exceptionally so. This indicates a balance between dry, cool periods and intervals of light to moderate rainfall rather than sustained heavy rain events.
The data suggests that rainfall occurred fairly evenly throughout the month, with no extreme precipitation peaks, but occasional windy and wet days consistent with transitioning toward early winter.
📊 November Rainfall by Year
The chart above displays total November rainfall for each recorded year, with 2025 highlighted in orange. It shows that November 2025’s rainfall was moderately above the historical average, placing it among the wetter but not extreme Novembers in the dataset.
In summary, November 2025 was cool, cloudy, and slightly wetter than average, with stable temperatures, frequent moisture in the air, and a few strong wind events, signaling the seasonal shift from autumn toward early winter.
This analysis was produced with the help of artificial intelligence, based on the weather data of Weather Station Nagu.
🌦️ Weather Analysis – October 2025
October 2025 was cool, wet, and breezy, reflecting typical late-autumn conditions. The average temperature was 8.4 °C, with daytime highs reaching 13.9 °C and the lowest reading falling to 1.2 °C. Average humidity was high at 87 %, indicating persistent cloud cover and damp air. The average air pressure stood at 1008 hPa, suggesting alternating low- and high-pressure systems throughout the month. Average wind speed was 2.8 m/s, while the strongest gusts reached 17.4 m/s, consistent with occasional autumn storms.
💧 Exceptionally Heavy Rainfall
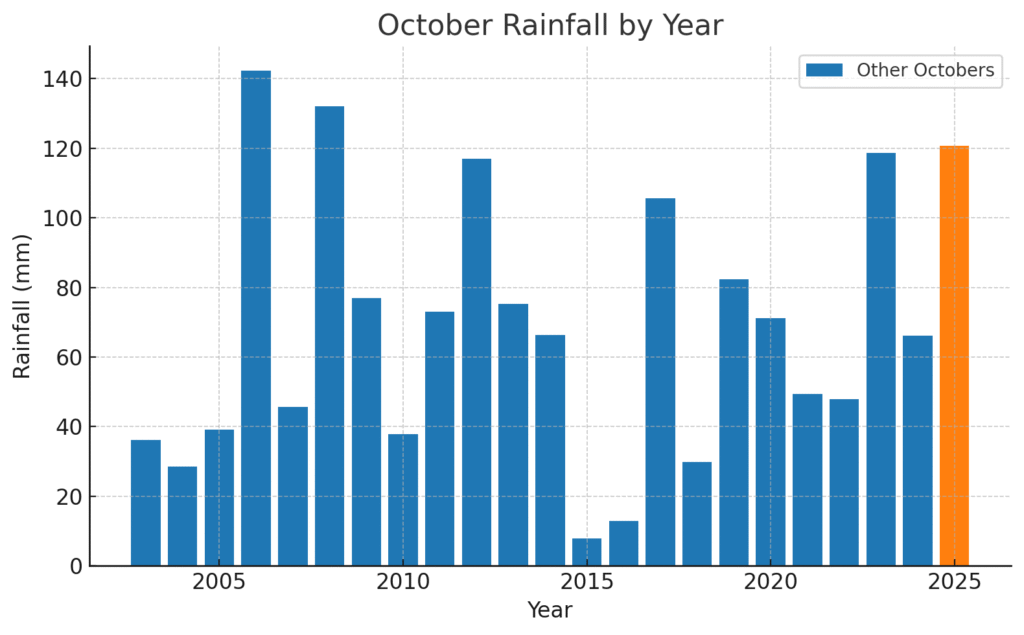
In total, 120.8 mm of rain fell during October 2025, making it an exceptionally wet month compared to long-term October averages.
The average October rainfall across the dataset was 68.8 mm, and the median was 66.4 mm, meaning October 2025 recorded nearly twice the usual amount.
It ranked as the third wettest October on record.
Such rainfall suggests frequent and prolonged wet periods, likely caused by multiple strong low-pressure systems moving through the region. With temperatures remaining above freezing, precipitation fell mainly as rain, not snow.
The chart above shows October rainfall across all recorded years, with October 2025 highlighted in orange, standing out clearly among the wettest Octobers in the dataset.
In summary, October 2025 was notably wetter and more unsettled than usual, marked by cool temperatures, persistent humidity, and frequent rainfall. It ranks among the rainiest Octobers on record, nearly doubling the typical precipitation for the month.
A significant technical change has taken place under the hood at the weather station in Nauvo, even though the outward changes are small. The PHP scripts behind the site had to be updated in order to move to the new version of PHP, version 8.x, on the web host. The previous version, PHP 7.x, is no longer maintained.
The biggest technical change concerned the charts. Previously, they were rendered as ready-made images by server-side scripts, but since the JpGraph library used no longer worked with PHP 8.x, the site’s charts are now generated so that the underlying PHP script retrieves the data from the database and then provides it in JSON format to the JavaScripts that draw the charts.
During Nov 1-3, Solar Radiation and UV Index were not measured and this was not noticed by Station Master. Weatherflow hub had lost wifi connectivity. Probably the storm on last Friday causing several power failures and power surges was a reason to this. Rebooting Weatherflow hub solved issue this morning.
We have lately experienced a time that has in media been narrated being an unusually long cold period in Finland. Among other things, this ha caused concerns of sufficiency of electricity production, and spot prices of electricity have been at record levels.
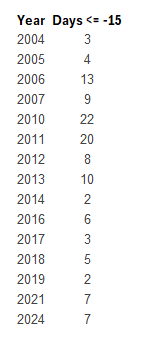
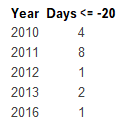
But, after all, has this period been unusual? Here are some figures from Weather Station Nagu’s database as of January 7, 2024. Data is recorded beginning summer 2003.
Amount of days where temperature has been below -15 °C:
Amount of days where temperature has been below -20 °C:
Conclusion is, that temperatures below -20 °C are quite rare here. Below -15 °C has been more common about ten years ago, but trend is clear, they have becoming more and more rare. But let’s see, how this winter develops!
Weather Station Nagu measures weather conditions using two equipment: Davis Vantage Pro 2 and WeatherFlow Tempest. While most of the observations are recorded by Vantage Pro, Solar Radiation and UV Index come from Tempest.
Due to very little sunshine during November, on November 30, 2023 at 3 pm, the Tempest’s solar powered battery was depleted, and Tempest shut down. After noticing this, Station Master brought up Tempest’s Power Booster, fixed it’s damages caused by water in it last winter and connected it. Tempest was up again on December 2, 2023 at 2 pm.
Solar Power and UV Index observations are set to NULL in WS database for the duration of Tempest’s outage.