[sv] Open post

Weather Summary of October 2026

This analysis was produced with the help of artificial intelligence, based on the weather data provided by the user.

October 2026 was a remarkably mild autumn month. It was the second warmest October in the station’s 24-year record, it passed without a single frost, and it saw the second highest October air pressure ever measured here. Rainfall was close to normal, slightly below average, while humidity stayed high and the month was largely grey and damp. The observations below are drawn from continuous 30-minute measurements at the station, and the comparisons use the full October record from 2003 to 2025 — 23 previous Octobers.

Weather Analysis

The mean temperature for October 2026 was 9.6 °C, which is 1.9 degrees above the long-term October average of 7.7 °C. That makes it the second warmest October in the record, surpassed only by the exceptional October 2020 (11.4 °C) and just ahead of 2022 (9.5 °C) and 2024 (9.4 °C). Three of the four warmest Octobers on record now fall within the last five years. Averaged over the month, daytime highs reached 11.5 °C and nights fell to 7.5 °C. The narrow daily range of about four degrees reflects persistent cloud and moist southerly air.

The maximum temperature was 16.2 °C, measured on 3 October at 16:30. That is above the long-term average October peak of 14.9 °C and ranks sixth in the record, though some way short of the warmest October reading of 17.9 °C from 2020. Only two days reached 15 °C, the 3rd and the 6th, so the month’s warmth came less from warm afternoons than from the consistent lack of cold weather.

The minimum temperature was 2.2 °C, recorded on 18 October at 08:30 and matched again the following morning. The long-term average October minimum is −0.9 °C, and in the coldest years the station has fallen to −4.8 °C (2003) and −4.7 °C (2012). October 2026’s minimum is the fifth mildest in the record, and the month was entirely frost-free — only the ninth October out of 24 to stay above zero. Only three nights dropped below 3 °C, all during the calm high-pressure spell of 18–20 October.

Within the month, the temperature curve had three distinct phases. The first ten days were the warmest, averaging 11.4 °C, with 6 October the warmest day at a daily mean of 13.9 °C. A sharp change came on 10 October, when colder air followed a deep low and the daily mean fell to 5.2 °C. The middle period from 11 to 20 October averaged 7.7 °C and included the coldest day of the month, 19 October (5.1 °C). The final third recovered to 9.6 °C as southerly winds returned, before the month closed on a cooler note at 7.2 °C on 31 October.

Humidity averaged 90.5 %, above the long-term October mean of 88.3 % and the eighth most humid October on record. Individual readings ranged from 50.6 % on 6 October, when a dry, gusty southwesterly flow briefly cleared the air, to 98.1 % on 17 October. On four days the daily average reached 95 % or more — 1, 2, 16 and 24 October — when fog, drizzle or low cloud kept the air close to saturation around the clock.

Mean air pressure was 1016.5 hPa, 4.9 hPa above the long-term October average of 1011.5 hPa and the fifth highest October mean on record. Behind that average lay an unusually wide range. The month opened under a strong high (1036.8 hPa on 1 October), but pressure then fell steeply and reached a low of 985.4 hPa on 9 October at 09:00 as a deep low passed, bringing the month’s heaviest rain. A powerful anticyclone then built in, and on 19 October at 13:30 pressure peaked at 1039.7 hPa — the second highest October reading in the record, exceeded only by 1040.9 hPa in 2016. Another low-pressure episode followed on 25–26 October, before pressure rose again to close the month near 1030 hPa. The 54.3 hPa spread between the extremes reflects a month that swung repeatedly between deep lows and strong highs.

Wind averaged 3.1 m/s, close to the long-term October average of 3.0 m/s (2.8 m/s if the unusually high 2020 value is excluded). The maximum gust was 17.9 m/s, from the south-southeast on 25 October at 19:30. That is somewhat below the long-term average October peak gust of 19.4 m/s and sits mid-table in the record, well short of the stormiest Octobers, 2019 (25.7 m/s) and 2006 (25.5 m/s). The windiest stretch ran from 25 to 27 October, with daily mean wind speeds above 5 m/s on all three days. The prevailing directions were south-southwesterly, south-southeasterly and southeasterly — a mild airflow from the southern sector that explains much of the month’s warmth. Under the high in mid-month, winds fell almost calm, with daily means barely above 1 m/s on 18 and 19 October.

Rainfall Analysis

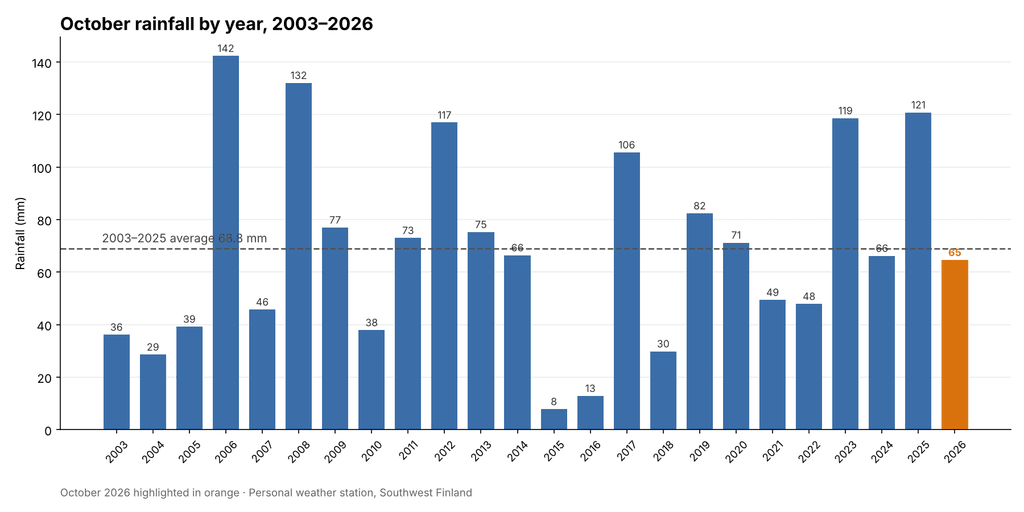
Total rainfall for October 2026 was 64.6 mm, against a long-term October average of 68.8 mm. The month therefore delivered 94 % of normal October rainfall, a small deficit of about 4 mm, and ranks fourteenth of the 24 Octobers in the record, almost exactly in the middle. The wettest Octobers remain 2006 (142.4 mm) and 2008 (132.0 mm), followed by the two most recent years before this one, 2025 (120.8 mm) and 2023 (118.6 mm). At the other end, October 2015 produced only 7.8 mm and 2016 just 12.8 mm. The average of the last ten Octobers is 70.5 mm, so this year was slightly below the recent norm as well.

Rain fell on 16 days at 0.2 mm or more, and on 12 days at 1 mm or more. Six days produced at least 5 mm, but only one exceeded 10 mm: 9 October with 18.6 mm, the wettest day of the month. Unlike September, when a single cloudburst dominated the total, October’s rain fell mostly as steady frontal rain of moderate intensity. The heaviest half-hour amount was 3.4 mm, on the morning of 9 October, and the highest rain rate was a brief 45.4 mm/h shortly after midnight on 26 October.

The wettest spell of the month came between 9 and 12 October, which together produced 34.2 mm — more than half of the month’s total — as the deep low of 9 October was followed by several days of showery weather. The longest dry spell was five days, from 18 to 22 October, under the strong high-pressure system. The final week brought a further 18.8 mm, mostly on 23 October (5.6 mm) and 26 October (9.6 mm), before the last two days turned dry. Split into thirds, the month’s rain fell as 25.8 mm, 20.0 mm and 18.8 mm, a fairly even distribution.

Seen in the context of the season, October continues the run of moderate, near-normal autumn rainfall after a wet early summer. June 2026 had 92.6 mm (average 37.6 mm), July 77.6 mm (average 52.7 mm), August only 34.2 mm (average 74.1 mm), September 66.0 mm (average 53.3 mm) and now October 64.6 mm. The five months from June to October together produced 335.0 mm, against a long-term average of 286.5 mm — about 117 % of normal.

Rainfall Comparison Chart

The chart below shows total October rainfall for every year from 2003 to 2026, with October 2026 highlighted. The dashed line marks the 2003–2025 average of 68.8 mm. This year’s total sits just below the line, in the middle of a very wide range that extends from 8 mm in 2015 to 142 mm in 2006. October is one of the most variable months at the station: totals above 100 mm have occurred in six different years, while four Octobers have produced less than 30 mm. Against that background, 2026 was an unremarkable, near-normal year.
Overall Assessment

October 2026 was a mild, humid and frost-free month with near-normal rainfall. Its mean temperature of 9.6 °C was 1.9 degrees above average and the second highest in the record, exceeded only by 2020. As in September, the warmth came from the absence of cold weather rather than from warm days: the maximum of 16.2 °C was only moderately above the normal October peak, while the minimum of 2.2 °C was among the mildest recorded here, and the month never saw a frost.

The month’s most striking feature was its air pressure. A mean of 1016.5 hPa was well above normal, and the strong anticyclone of 18–20 October produced the second highest October reading on record (1039.7 hPa), only ten days after a deep low had pushed the barometer down to 985.4 hPa. These swings shaped the weather: the deep low of 9 October brought the wettest day and a sharp cool-down, while the high brought the month’s only dry, calm and chilly spell.

Rainfall of 64.6 mm, or 94 % of normal, placed the month squarely in the middle of the record. The rain came mostly as moderate frontal rain spread across 16 days, with the 9–12 October period accounting for more than half the total. Winds were close to average, and the strongest gust of 17.9 m/s on 25 October was below the typical October peak.

Taken together, October 2026 was a gentle and unusually mild autumn month: grey and damp at times, but without frost, storms or heavy downpours. It will be remembered mainly for its warmth — continuing a clear recent trend of mild Octobers — and for the powerful high-pressure system that briefly took the barometer close to its October record.


Key figures at a glance

MeasureOctober 20262003–2025 average
Mean temperature9.6 °C7.7 °C
Maximum temperature16.2 °C (3 Oct)14.9 °C
Minimum temperature2.2 °C (18 Oct)−0.9 °C
Mean humidity90.5 %88.3 %
Mean air pressure1016.5 hPa1011.5 hPa
Pressure range985.4 – 1039.7 hPa—
Mean wind speed3.1 m/s3.0 m/s
Maximum gust17.9 m/s (25 Oct, SSE)19.4 m/s
Total rainfall64.6 mm68.8 mm
Rain days (≥ 0.2 mm)16—
Wettest day18.6 mm (9 Oct)—
[sv] Open post

Weather Summary of September 2026

This analysis was produced with the help of artificial intelligence, based on the weather data provided by the user.

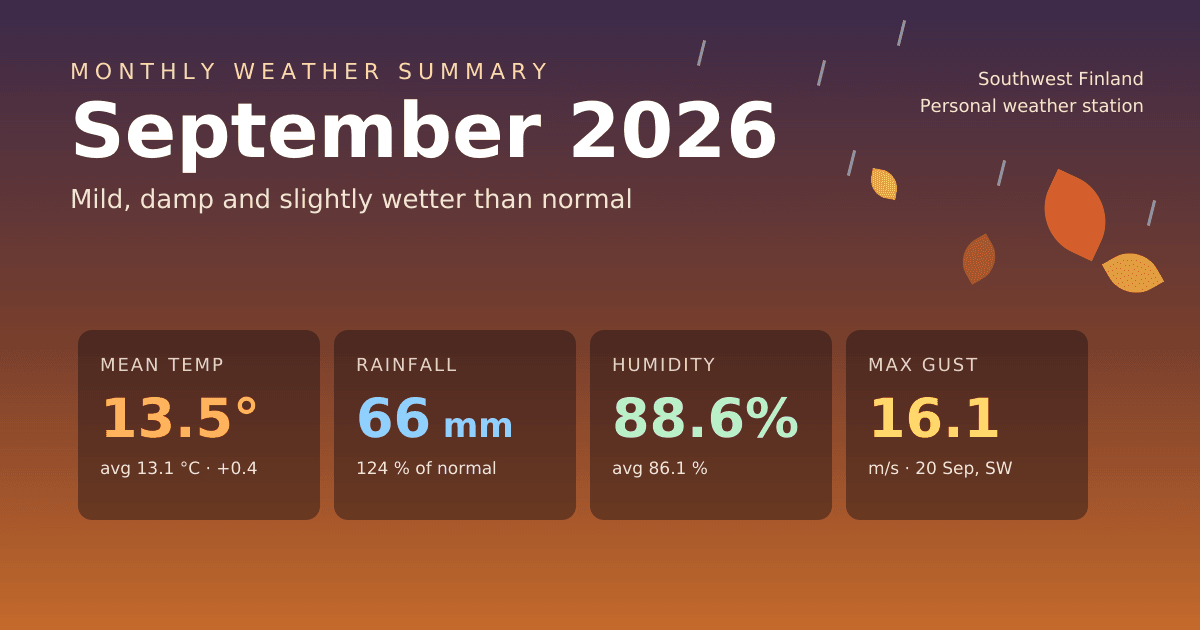
September 2026 brought a gentle, damp start to autumn. The month was slightly warmer than average, but the warmth came from mild nights rather than warm days, and it was wetter, more humid and lower in pressure than a typical September. Like August, it passed without any real extremes: no late-summer heat, no early frost and no storm-force winds. The observations below are drawn from continuous 30-minute measurements at the station, and the comparisons use the full September record from 2003 to 2025 — 23 previous Septembers.

Weather Analysis

The mean temperature for September 2026 was 13.5 °C, which is 0.4 degrees above the long-term September average of 13.1 °C. That makes it the ninth warmest September in the 24-year record — comfortably on the mild side, but some way short of the warmest years, 2023 (15.2 °C), 2006 (14.7 °C) and 2020 and 2024 (both 14.6 °C). Averaged over the month, daytime highs reached 16.5 °C and nights fell to 10.8 °C. The daily swing of under six degrees was narrow even by autumn standards, reflecting a month spent mostly under cloud.

The maximum temperature was 20.6 °C, measured on 1 September at 16:00. That is below the long-term September average peak of 21.3 °C, and it was the only time the month reached 20 °C. It was effectively summer’s last word: after the first week the warmth faded quickly, and from 8 September onwards no day climbed above 16.7 °C. For comparison, the warmest September reading on record is 26.5 °C, from 2024.

The minimum temperature was 7.2 °C, recorded on 23 September at 08:30. This is the month’s most remarkable figure. The long-term average September minimum is 5.1 °C, and in the coldest years the station has dropped to 1.5 °C (2014) and 2.0 °C (2013). September 2026’s minimum is the second mildest in the record, beaten only by 2020 (8.7 °C). Nights dropped below 10 °C on ten occasions, but never came close to frost. The month’s above-average mean temperature is therefore a story about the absence of cold nights, not about warm days.

Within the month, temperatures followed a steady seasonal decline. The first ten days were the warmest (mean 14.6 °C), with 1 September the warmest day at a daily mean of 17.0 °C. The middle period from 11 to 20 September averaged 13.7 °C, and the final third cooled to 12.3 °C. The coldest day was 23 September (10.8 °C), which followed a clear, high-pressure night.

Humidity averaged 88.6 %, above the long-term September mean of 86.1 % and the sixth most humid September on record. Individual readings ranged from 56.5 % to 98.0 %. On five days the daily average reached 95 % or more — 8, 9, 16, 25 and 26 September — all of them rain days, when the air stayed close to saturation around the clock. This persistent moisture went hand in hand with the mild nights and the small daily temperature range.

Mean air pressure was 1010.4 hPa, 2.2 hPa below the long-term September average of 1012.6 hPa and the fifth lowest September mean on record. The month also had an unusually wide spread. Pressure fell to a low of 994.1 hPa on 5 September at 03:30 as a deep low passed, and stayed generally low through an unsettled middle section, with daily means around 998–1004 hPa between 16 and 20 September. The final days then brought a sharp turnaround: a strong high-pressure system built from 27 September, and pressure peaked at 1037.5 hPa late on 30 September. The 43.4 hPa range between the extremes reflects a month that moved from low-pressure dominance to a firmly anticyclonic close.

Wind averaged 2.6 m/s, almost exactly the long-term September average of 2.7 m/s. The maximum gust was 16.1 m/s, from the southwest on 20 September at 02:30, during the last of the mid-month low-pressure systems. That is well below the long-term average September peak gust of 18.8 m/s, and it is the fifth lowest September peak gust in the record — a long way from 29.5 m/s in 2020 or 27.4 m/s in 2019. The windiest stretch of the month ran from 16 to 20 September. The prevailing directions were south-southwesterly, southwesterly and southerly, bringing in the mild, moist air that defined the month, with a shorter northerly and northwesterly component behind the passing fronts.

Rainfall Analysis

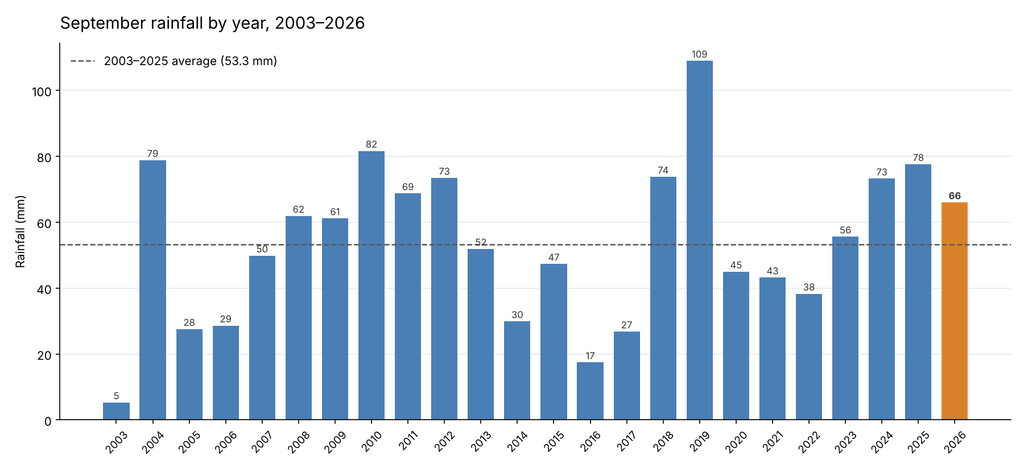
Total rainfall for September 2026 was 66.0 mm, against a long-term September average of 53.3 mm. The month therefore delivered 124 % of normal September rainfall, a surplus of about 13 mm, and ranks as the ninth wettest September in the 24-year record. The wettest September by a clear margin remains 2019 (109.0 mm), followed by 2010 (81.6 mm) and 2004 (78.8 mm); at the other end, September 2003 produced only 5.3 mm. The average of the last ten Septembers is 56.0 mm, so this year continues a recent run of wetter-than-average Septembers: 2023, 2024 and 2025 were also above the norm.

Rain fell on 15 days at 0.2 mm or more, and on 9 days at 1 mm or more. Seven days produced at least 5 mm and two exceeded 10 mm: 10 September with 16.8 mm, the wettest day of the month, and 25 September with 10.0 mm. In contrast to August, when rain arrived only in light showers, September rain came in several substantial frontal episodes.

The month opened with six completely dry days (1–6 September), the longest dry spell of the month. The first and wettest rainy period followed between 7 and 10 September, which together produced 30.0 mm — almost half of the month’s total. Its peak came on 10 September at 12:30, when an intense downpour delivered 14.2 mm in half an hour, with a peak rain rate of 93.6 mm/h. That single half-hour accounts for more than a fifth of the whole month’s rain. A second unsettled period from 16 to 20 September added 17.6 mm, and a third on 25–26 September brought 16.2 mm. The final four days, under the building high, were practically dry. Split into thirds, the month’s rain fell as 30.0 mm, 18.0 mm and 18.0 mm.

Seen in the context of the season, September resumes the wet pattern of early summer after August’s dry interlude. June 2026 had 92.6 mm (average 37.6 mm), July 77.6 mm (average 52.7 mm), August only 34.2 mm (average 74.1 mm), and now September 66.0 mm. The four months from June to September together produced 270.4 mm, against a long-term average of 217.7 mm — about 124 % of normal.

Rainfall Comparison Chart

The chart below shows total September rainfall for every year from 2003 to 2026, with September 2026 highlighted. The dashed line marks the 2003–2025 average of 53.3 mm. This year’s total sits clearly above the line but well within the normal range of variation, which extends from 5 mm in 2003 to 109 mm in 2019. The chart also shows the recent shift: after a run of drier Septembers from 2020 to 2022, each of the last four years has finished above average.

Overall Assessment

September 2026 was a mild, damp and somewhat wet month with no weather extremes. Its mean temperature of 13.5 °C was slightly above average, but the warmth was carried almost entirely by the nights. The maximum of 20.6 °C on the first day of the month was below the normal September peak, whereas the minimum of 7.2 °C was the second mildest in the record. Persistent cloud, high humidity (88.6 %) and southwesterly airflow kept the daily temperature range narrow and held off any early frost.

Rainfall of 66.0 mm, or 124 % of normal, made it the ninth wettest September in the record and the fourth above-average September in a row. Unlike the light, scattered showers of August, the rain came in three distinct frontal episodes, the first of which included the month’s most notable single event: the 14.2 mm downpour on 10 September.

Low pressure dominated most of the month, with a mean of 1010.4 hPa, before a strong high took over at the very end and pushed the barometer to 1037.5 hPa on 30 September. Despite the unsettled pattern, the winds remained moderate. The peak gust of 16.1 m/s was among the lowest recorded here in September.

Taken together, September 2026 was a soft transition into autumn: rainy and grey at times, but without storms, heat or frost. It will be remembered mainly for its unusually mild nights and for the sudden cloudburst of 10 September.


Key figures at a glance

MeasureSeptember 20262003–2025 average
Mean temperature13.5 °C13.1 °C
Maximum temperature20.6 °C (1 Sep)21.3 °C
Minimum temperature7.2 °C (23 Sep)5.1 °C
Mean humidity88.6 %86.1 %
Mean air pressure1010.4 hPa1012.6 hPa
Pressure range994.1 – 1037.5 hPa—
Mean wind speed2.6 m/s2.7 m/s
Maximum gust16.1 m/s (20 Sep, SW)18.8 m/s
Total rainfall66.0 mm53.3 mm
Rain days (≥ 0.2 mm)15—
Wettest day16.8 mm (10 Sep)—
[sv] Open post

Weather Summary of August 2026

This analysis was produced with the help of artificial intelligence, based on the weather data provided by the user.

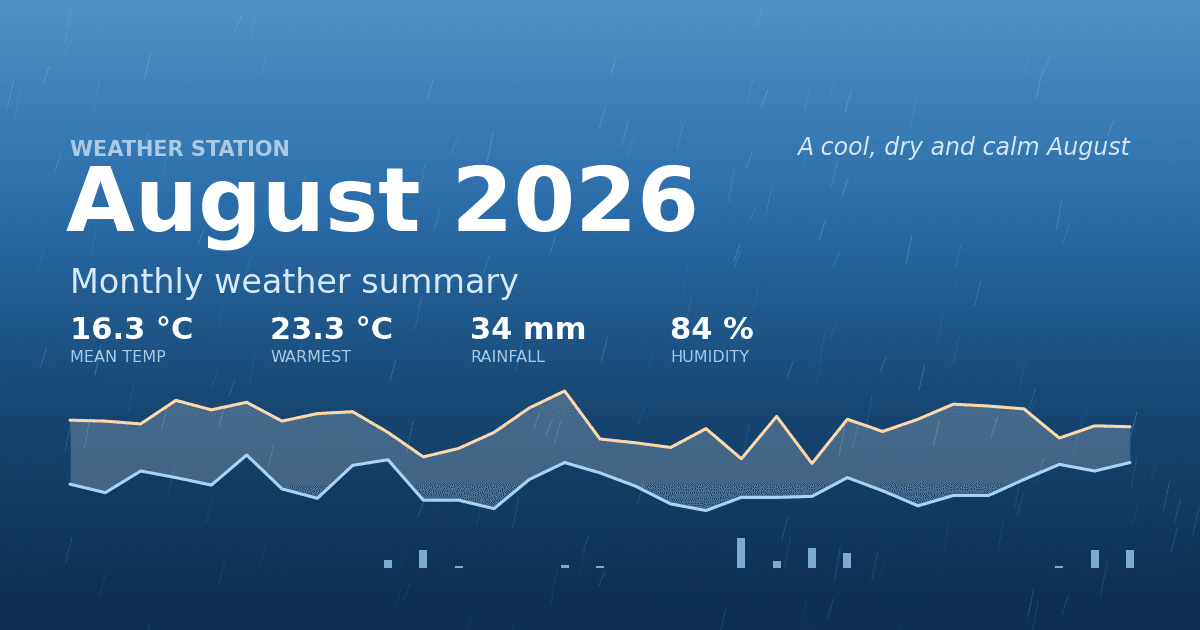
August 2026 closed the summer on a subdued note. It was a month without a single genuinely hot day, with a rainfall total well under half of the long-term average, and with the weakest peak wind gusts the station has recorded in an August for years. The observations below are drawn from continuous 30-minute measurements at the station, and the comparisons use the full August record from 2003 to 2025 — 23 previous Augusts.

Weather Analysis

The mean temperature for August 2026 was 16.3 °C, which is 0.9 degrees below the long-term August average of 17.2 °C. That makes it the seventh coolest August in the 24-year record, following a run of below-average Augusts — 2025 (15.9 °C), 2021 (15.9 °C) and 2016 (16.1 °C) were all cooler still. Averaged over the month, daytime highs reached 19.7 °C and nights dropped to 13.3 °C, giving a modest daily swing of just over six degrees, typical of a month dominated by cloud and moist air rather than clear skies.

The most striking feature of the month is the maximum temperature of 23.3 °C, measured on 15 August at 15:30. In a normal August the station records a peak of about 27 °C, and in the warmest years the reading has climbed above 30 °C — 33.1 °C in 2014, 32.5 °C in 2023. August 2026’s peak is the second lowest August maximum in the entire record, marginally above the 23.2 °C of 2021. Not one day in the month reached 25 °C, although 16 of the 31 days did climb to 20 °C or above, so the month was persistently mild rather than genuinely cold.

The other end of the scale tells the same story from the opposite direction. The minimum temperature was 10.6 °C, recorded on 19 August at 02:00. That is well above the long-term August minimum average of 9.5 °C, and among the mildest August minima on record. There was no cold snap: the temperature never approached the single figures that most Augusts produce at least once. In other words, the month was compressed at both ends — no heat, but no chill either — and the whole distribution simply sat about one degree below normal.

Within the month, the first ten days were the warmest stretch (mean 17.3 °C), peaking on 6 August with a daily mean of 19.2 °C. A distinctly cooler middle period followed from 11 to 20 August (mean 15.5 °C), which also contained the coldest day of the month, 20 August, at 14.2 °C. The final third recovered only slightly, to 16.2 °C.

Humidity averaged 84.0 %, above the long-term August mean of 81.9 % and among the more humid Augusts on record. Individual readings ranged from 51.9 % to 98.0 %, and on four days the daily average exceeded 94 %, with the air close to saturation around the clock. This persistently damp air is consistent with the muted temperature range: moisture and cloud suppressed both daytime heating and night-time cooling.

Mean air pressure was 1011.1 hPa, almost exactly the long-term August average of 1010.6 hPa, but the month was far from uniform. Pressure fell to a monthly low of 997.5 hPa on 20 August, when a low-pressure system delivered the heaviest rain of the month, and rose to 1027.0 hPa on 27 August during a settled, high-pressure spell in the final week. That 29.5 hPa spread between the extremes captures the month’s structure well: an unsettled middle section bracketed by two quieter, higher-pressure periods.

Wind averaged 2.8 m/s, somewhat above the long-term average of 2.4 m/s, so the month was breezy in an everyday sense. The maximum gust was only 13.9 m/s, from the southwest on 9 August at 18:00 — the fifth lowest August peak gust in the record, against a long-term average peak of 16.1 m/s and against 21.5 m/s in 2023. The month therefore combined a steady, moderate airflow with a complete absence of storm-force gusts. The prevailing directions were southwesterly and southerly, which brought in the mild, moist maritime air that characterised the month.

Rainfall Analysis

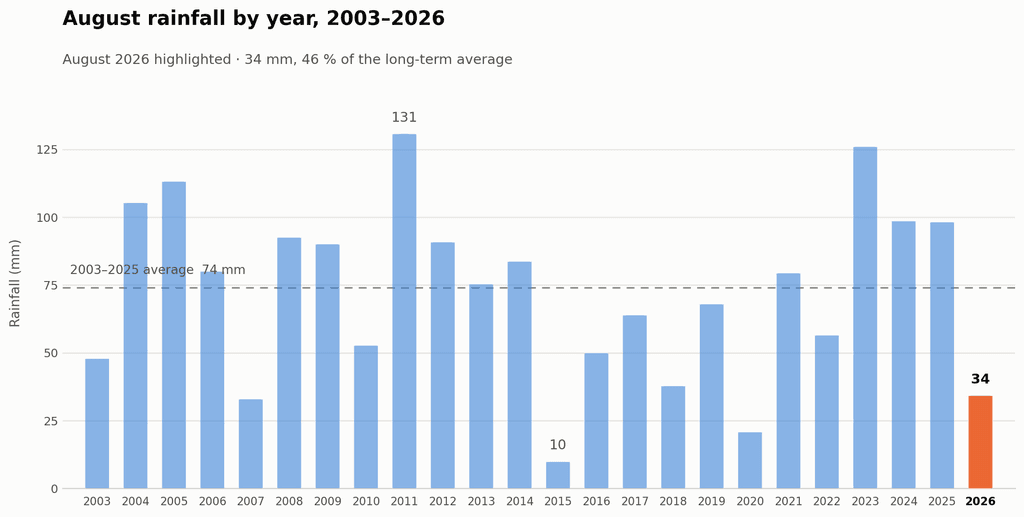
Total rainfall for August 2026 was 34.2 mm, against a long-term August average of 74.1 mm. The month therefore delivered only 46 % of normal August rainfall, a deficit of about 40 mm, and ranks as the fourth driest August in the 24-year record. Only 2015 (9.9 mm), 2020 (20.8 mm) and 2007 (33.0 mm) were drier. For comparison, the wettest August on record, 2011, produced 130.7 mm — nearly four times this year’s total — and the average of the last ten Augusts alone is 69.9 mm.

Rain fell on 12 days at 0.2 mm or more, but only 8 days produced at least 1 mm, and no day exceeded 7.2 mm. The month was thus dry not because rain events were rare, but because they were consistently light: the station never recorded the heavy day-long rainfall that normally lifts an August total past 70 mm.

The distribution across the month was strongly uneven. The first nine days were completely dry, the longest rainless spell of the month, and the whole first half yielded just 7.6 mm. The remaining 26.6 mm fell in the second half, concentrated around two unsettled periods: 20–23 August, which brought 17.2 mm including the wettest day of the month (7.2 mm on 20 August), and the closing days 29–31 August, which added 9.0 mm. The heaviest short-duration rainfall occurred on 20 August at 12:30, when the rain rate briefly reached 35.6 mm/h, though the shower was too short to accumulate much. A second dry spell of five days ran from 24 to 28 August under the high-pressure ridge.

Seen in the context of the whole summer, August’s dryness is a reversal rather than a continuation. June 2026 was exceptionally wet at 92.6 mm against an average of 37.6 mm, and July 2026 also ran wet at 77.6 mm against 52.7 mm. The summer as a whole was therefore wetter than normal, with August alone providing the dry interlude.

Rainfall Comparison Chart

The chart below shows total August rainfall for every year from 2003 to 2026, with August 2026 highlighted. The dashed line marks the 2003–2025 average of 74 mm. The chart makes clear how far below the long-term norm this August fell, and how much year-to-year variability the station’s August record contains — from under 10 mm in 2015 to over 130 mm in 2011.

Overall Assessment

August 2026 was a cool, dry and unusually calm month, with no weather extremes in any direction. Its defining characteristic was the absence of heat: with a maximum of 23.3 °C, it was the second coolest August peak in 24 years, and the mean temperature of 16.3 °C continued the recent run of below-average Augusts. At the same time, the mild minimum of 10.6 °C, the high average humidity of 84.0 % and the small daily temperature range point to a month spent under moist southwesterly air and persistent cloud, which kept both heat and frost-adjacent cold at bay.

Rainfall, at 34.2 mm or 46 % of normal, was the month’s other notable anomaly, though it should be read alongside a wet June and July rather than as a summer-long drought. Only the second half of August produced meaningful rain, and even then in light, short-lived events.

Taken together, the month can fairly be described as quiet weather: no heat waves, no cold snaps, no storms — the peak gust of 13.9 m/s was among the lowest ever recorded here in August — and no heavy rainfall days. For the record books, August 2026 will be remembered less for what happened than for what did not: it is the summer month in which the station’s thermometer never reached 25 °C.

Key figures at a glance

MeasureAugust 20262003–2025 average
Mean temperature16.3 °C17.2 °C
Maximum temperature23.3 °C (15 Aug)27.3 °C
Minimum temperature10.6 °C (19 Aug)9.5 °C
Mean humidity84.0 %81.9 %
Mean air pressure1011.1 hPa1010.6 hPa
Pressure range997.5 – 1027.0 hPa—
Mean wind speed2.8 m/s2.4 m/s
Maximum gust13.9 m/s (9 Aug, SW)16.1 m/s
Total rainfall34.2 mm74.1 mm
Rain days (≥ 0.2 mm)12—
[sv] Open post

Weather Summary of July 2026

This analysis was produced with the help of artificial intelligence, based on the weather data provided by the user.

Weather Analysis

July 2026 was a cool and unsettled midsummer month. The mean temperature for the month was 17.2 °C, which is roughly 1.1 °C below the July average of 18.3 °C for the reference period 2004–2025. In the 23-year comparison, July 2026 ranks among the cooler third of Julys — clearly warmer than the coolest Julys of 2015 and 2017 (around 16.2 °C), but far from warm Julys such as 2018 (21.5 °C) or 2010 (21.1 °C).

The month’s highest temperature, 27.3 °C, was recorded on the afternoon of 16 July. Only six days reached the 25 °C heat threshold, so genuine hot spells remained short and modest; the reading falls well short of the station’s July record of 34.4 °C (2018 and 2019). The lowest temperature of the month, 10.7 °C, was measured in the early hours of 7 July — almost exactly the typical July minimum for the reference period.

Mean relative humidity was 82 %, notably above the July average of 77 % and among the highest July values in the dataset, consistent with the month’s rainy and overcast character. Mean air pressure was 1009.6 hPa, essentially at the long-term July level (1009.5 hPa), though the month saw considerable variation, with pressure ranging from 993.9 hPa to 1022.5 hPa as low-pressure systems repeatedly crossed the region.

Winds remained gentle throughout the month. The average wind speed was 2.4 m/s, matching the typical July level, and the strongest gust of the month, 13.4 m/s from the west-northwest (WNW), was recorded on 6 July. This is a modest peak by July standards — the reference-period Julys average a maximum gust of about 15.8 m/s, and July 2025 produced a 22.4 m/s gust.

Rainfall Analysis

Total rainfall in July 2026 was 77.6 mm, which is 145 % of the 2004–2025 July average of 53.4 mm. This makes July 2026 the sixth-wettest July in the 2004–2026 record, behind only 2007 (125.6 mm), 2004 (95.3 mm), 2015 (84.8 mm), 2009 (83.5 mm) and 2012 (81.1 mm).

Rain fell frequently: 16 days recorded at least 0.2 mm of precipitation, meaning more than every second day was a rain day. The accumulation was nevertheless strongly skewed — the heaviest daily total, 32.6 mm on 18 July, alone accounted for over 40 % of the monthly sum. The final days of the month stayed unsettled as well, with 22.4 mm falling between 26 and 31 July.

The wet July continues a pattern in which recent Julys (2025: 68.4 mm, 2023: 58.2 mm) have tended toward the rainy side of the distribution, in contrast to dry Julys such as 2017 (12.1 mm), 2010 (14.5 mm) and 2006 (14.7 mm).

The chart shows July rainfall totals by year for 2004–2026. July 2026 is highlighted in red, and the dashed line marks the 2004–2025 historical average of 53.4 mm.

Overall Assessment

July 2026 will be remembered as a cool, damp and grey midsummer month. The mean temperature fell about a degree short of the long-term average, heat days were few, humidity ran clearly above normal, and rainfall reached 145 % of the historical average, placing the month among the six wettest Julys in the station’s record. Wind conditions, by contrast, were calm even by July standards. In character, the month resembled the cool, rain-dominated Julys of 2004 and 2012, though somewhat milder in degree — a summer month shaped more by passing low-pressure systems than by high-pressure warmth.

[sv] Open post

Weather Summary of June 2026

This analysis was produced with the help of artificial intelligence, based on the weather data provided by the user.

Weather Analysis

June 2026 was a month of two distinct halves. The first half was cool and unsettled, with a mean temperature of just 14.5 °C, while the second half turned progressively warmer, averaging 17.2 °C. Overall, the monthly mean temperature settled at 15.8 °C, slightly above the long-term June average of 15.2 °C recorded at this station since 2004.

The month began on a chilly note: the lowest temperature of the month, 9.0 °C, was measured in the early hours of 1 June at 05:00. Cool conditions persisted through mid-month, with 14 June standing out as the coldest day, averaging only 12.2 °C under low pressure and heavy rain. Summer warmth arrived in earnest during the final week. The warmest day was 27 June with a daily mean of 20.2 °C, and the month’s highest reading of 26.7 °C was recorded on 29 June at 15:00. Two days — 27 and 29 June — saw maxima at or above 25 °C, meeting the Finnish threshold for a hot day (helle).

Average relative humidity was high at 80 %, reflecting the wet character of the month, with readings ranging from 38 % during the warm, dry spell late in the month to 98 % during rain events.

Air pressure averaged 1012.5 hPa. The barometric low point of 995.6 hPa occurred on the morning of 14 June as an active low-pressure system crossed the region, bringing the month’s coldest and one of its wettest days. Pressure peaked at 1022.7 hPa on 23 June as high pressure built in ahead of the warm final week.

Winds were moderate throughout the month, averaging 2.5 m/s with a clear prevailing direction from south-southwest and south. The strongest gust of the month, 13.4 m/s, was recorded on 10 June at 16:30.

Rainfall Analysis

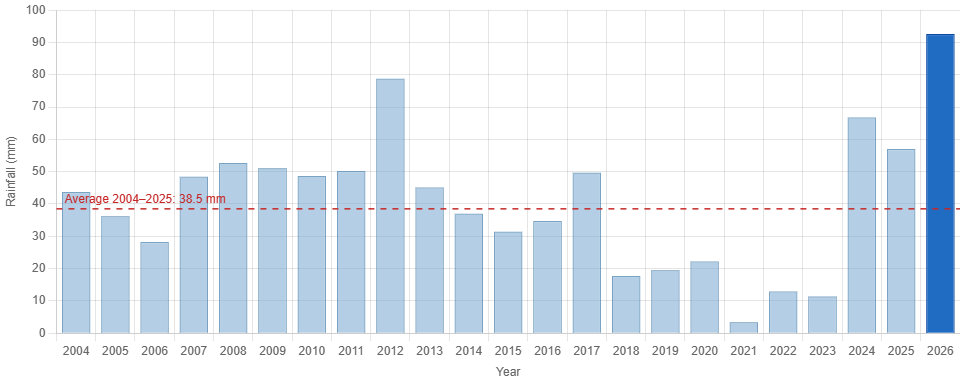
Rainfall was the defining feature of June 2026. The month delivered a total of 92.6 mm, which is 241 % of the historical June average of 38.5 mm (2004–2025) and makes it the wettest June in the station’s record, comfortably surpassing the previous high of 78.8 mm from June 2012.

Rain fell on 11 days (≥ 0.2 mm), but the bulk of the monthly total came from three major events. The wettest day was 15 June with 30.6 mm — nearly a third of the monthly total in a single day — followed by 20.2 mm on 6 June and 18.4 mm on 14 June. The 6 June event was particularly intense, producing the month’s peak rainfall rate of 65.8 mm/h at 13:30, indicative of heavy convective showers. Together, the period 14–15 June brought 49.0 mm, more than an entire average June’s worth of rain in 48 hours. In contrast, the final ten days of the month were largely dry, coinciding with the building high pressure and rising temperatures.

The contrast with recent years is striking: June rainfall totals of 3.4 mm (2021), 12.9 mm (2022), and 11.4 mm (2023) marked a run of exceptionally dry early summers, whereas 2024 (66.8 mm), 2025 (57.0 mm), and now 2026 (92.6 mm) represent three consecutive Junes well above the long-term average.

Key figures from the chart: 2026 — 92.6 mm (record); previous record 2012 — 78.8 mm; historical average — 38.5 mm; driest June — 2021 with 3.4 mm.

Overall Assessment

June 2026 will be remembered above all for its record-breaking rainfall — 92.6 mm, nearly two and a half times the long-term average and the highest June total in more than two decades of station records. Thermally the month was close to normal (15.8 °C against a 15.2 °C average), but this headline figure conceals a cool, wet, and unsettled first three weeks followed by a warm and dry finish, capped by the month’s high of 26.7 °C on 29 June. The heavy mid-month rainfall, delivered largely in a few intense events, replenished soil moisture thoroughly after what had been a fairly typical spring, and set the stage for July with abundant ground water and, in the final days of June, genuinely summery warmth.

[sv] Open post

Weather Summary of May 2026

This analysis was produced with the help of artificial intelligence, based on the weather data provided by the user.


Weather Analysis

May 2026 was a cool and changeable late-spring month, with a mean temperature of 10.7 °C — very close to, and marginally above, the station’s long-term May average of 10.4 °C (2004–2025). The month’s highest temperature, 23.1 °C, was recorded on 23 May, the warmest moment of an extended mild spell that dominated the final third of the month. The lowest reading, 0.5 °C, occurred in the early hours of 7 May, when clear skies and light winds during a cold-air outbreak brought temperatures to the brink of frost — though, notably, the month passed without a single sub-zero reading.

The month divided clearly into two halves. The opening two weeks were dominated by cool, often raw conditions: between 3 and 14 May, daily mean temperatures hovered mostly between 6 and 9 °C, with several days failing to exceed 10 °C even at their peak. From mid-month onwards the pattern relaxed, and the period from 19 May to month’s end brought consistently double-digit daily means, culminating in the 23 °C warmth of the 23rd and a second push to 21.8 °C on the 30th. Only two days of the month reached the 20 °C threshold.

Relative humidity averaged 73 %, spanning a wide range from a very dry 23 % during sunny, well-mixed afternoons to 97 % in damp and rainy conditions — a spread typical of May, when strong daytime insolation can dry the boundary layer dramatically.

Air pressure averaged 1012.1 hPa, with considerable synoptic activity. The barometer peaked at 1028.2 hPa on 9 May under a cold but settled high-pressure ridge, and bottomed out at 991.8 hPa on 13 May as a low-pressure system delivered the month’s heaviest rainfall. Winds blew predominantly from the southwesterly to westerly sector (SSW, WNW, W, and SW being the most frequent directions), averaging a moderate 2.6 m/s. The strongest gust of the month, 15.6 m/s, was measured on 27 May in a brisk westerly flow.


Rainfall Analysis

Total precipitation for May 2026 amounted to 33.0 mm, distributed across ten days with measurable rain, of which five produced 1 mm or more. The rainfall was strongly concentrated in a single mid-month wet spell: between 11 and 15 May, a slow-moving low-pressure system delivered 22.6 mm — over two-thirds of the monthly total — with the wettest single day being 13 May at 12.6 mm. A secondary, lighter event on 19 May contributed 5.4 mm, and early-month rain on 4 May added 3.6 mm. Outside these episodes the month was largely dry, with the final week recording no precipitation at all.

Against the historical May mean of 28.4 mm (station records 2004–2025), the 2026 total of 33.0 mm represents approximately 116 % of the long-term average — a modestly wet outcome, though comfortably within the normal range. As the chart below illustrates, May rainfall at this station is highly variable, ranging from a remarkably arid 1.0 mm in 2024 to 58.5 mm in 2011. May 2026 sits in the upper-middle portion of this distribution, close to the totals of 2005, 2016, and 2025, and continues the recovery from the extreme dryness of May 2024.

[sv] Open post

Weather Summary of April 2026

This analysis was produced with the help of artificial intelligence, based on the weather data provided by the user

Weather Analysis

April 2026 was a cool and predominantly dry month. The mean temperature for the month was 5.2 °C, which sits notably below the climatological expectation for the region in April, reflecting a persistent influence of cold northerly and north-westerly airflows through much of the period. The absolute maximum temperature reached 16.7 °C on the 17th, which was the only day when conditions felt genuinely spring-like, supported by a southerly or south-westerly fetch of milder air. At the other extreme, the month’s minimum fell to −2.9 °C on the 9th, underscoring the continued frost risk well into the second week. Overnight sub-zero readings were recorded on no fewer than eight days, with the coldest spell clustering around the 9th–12th when daytime maxima also struggled to exceed 10 °C despite occasional sunshine.

The first half of April was markedly colder than the second. Temperatures in the opening ten days rarely lifted above 9 °C and dipped below freezing on several nights. A gradual warming trend emerged from around the 13th, with a warm interlude between the 13th and 21st when afternoon temperatures consistently reached double figures, peaking on the 17th. After the 21st, temperatures eased back to a more typical — but still cool — range of 7–10 °C for afternoon maxima, settling into a steady but unspectacular close to the month.

Relative humidity averaged 71.6 %, which is moderate and consistent with the predominantly northerly and continental airflow pattern. Winds were dominated by the north-westerly quadrant throughout April; NW was the single most frequent direction, accounting for roughly 18 % of all half-hourly observations, closely followed by NNW at 17 %. Southerly and south-south-westerly flows were present but secondary, associated with the brief milder episodes mid-month. The mean wind speed was 2.8 m/s, indicating a generally light to moderate breeze, though the recorded maximum gust of 16.1 m/s (approximately 58 km/h) points to at least one episode of stronger, gusting conditions, most likely associated with a passing frontal system or a trough moving through in the first week. Atmospheric pressure averaged 1017.2 hPa, with a relatively wide range between a minimum of 984.9 hPa and a maximum of 1033.2 hPa — a spread of 48 hPa that reflects active synoptic variability, including at least one deep low-pressure system passing through and one well-developed anticyclone dominating conditions mid-month during the warmer interlude.


Rainfall Analysis

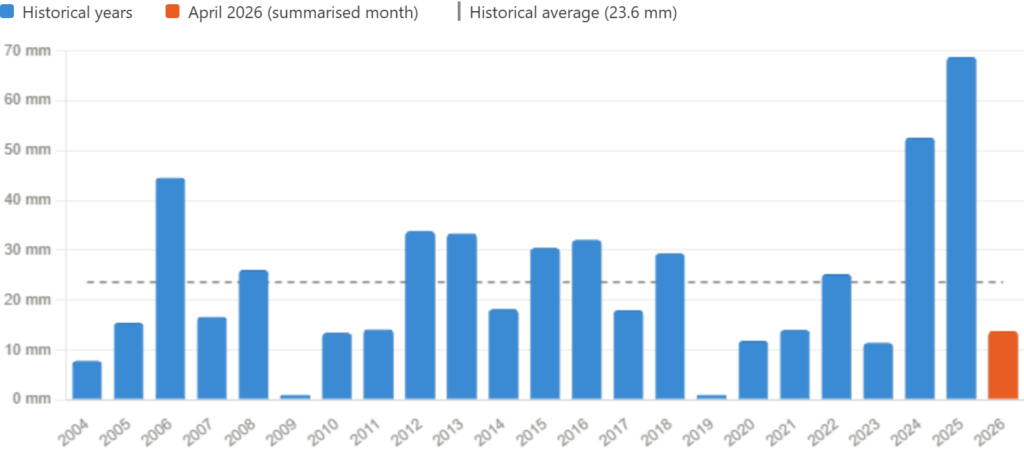
Total rainfall for April 2026 was 13.8 mm, making it a considerably drier-than-average month. All measurable precipitation fell within a narrow three-day window at the start of the month: 4.2 mm on the 4th, 5.8 mm on the 5th, and 3.2 mm on the 6th, likely attributable to a frontal system moving through the area. From the 7th onwards, the month was essentially dry, with only negligible amounts (0.4 mm and 0.2 mm) recorded on the 16th and 17th respectively, and no rain at all during the final ten days.

Against a historical mean of 23.6 mm for April (based on station records from 2004 to 2025), the month’s total represents roughly 58 % of the average — a deficit of approximately 9.8 mm. Measured against the historical median of 18.1 mm, which is a more robust central measure given the notable variability in the dataset, April 2026 still falls short by around 4 mm. As shown in the chart above, precipitation in April has ranged from as little as 1.0 mm (2009 and 2019) to as much as 68.8 mm (2025), highlighting the considerable year-to-year variability typical of spring in this region. The two preceding years were both well above average — 52.6 mm in 2024 and an exceptional 68.8 mm in 2025 — making 2026’s total particularly striking by contrast, though it is by no means the driest April on record.


Overall Assessment

April 2026 was a cool, settled, and largely dry month. The defining characteristic was the dominance of northerly and north-westerly airflow throughout most of the period, which suppressed temperatures, kept humidity at moderate levels, and ultimately blocked the development of any significant precipitation-bearing systems after the opening week. The brief warm spell centred on 15–17 April, when the only 16 °C+ temperature of the month was recorded, provided a temporary but welcome break from the prevailing cold pattern.

From a hydrological perspective, the month’s rainfall total of 13.8 mm represents a clear shortfall relative to historical norms, coming in at under 60 % of the long-term April average. This follows two successive above-average Aprils and places 2026 in the drier third of the historical distribution, though it does not approach the exceptionally low totals of 2009 or 2019. Overall, April 2026 was an unremarkable transitional month — neither severely cold nor warm, neither notably wet nor a record drought — but distinctly on the cool and dry side of the seasonal average.

[sv] Open post

Weather Summary of March 2026

This analysis was produced with the help of artificial intelligence, based on the weather data provided by the user.


Weather Analysis

March 2026 was characterized by generally cool early-spring conditions, with gradual warming toward the end of the month but still remaining within a relatively narrow thermal range.

The average temperature for the month was 2.4 °C, indicating a slightly cool March overall. The maximum recorded temperature reached 8.7 °C, while the minimum dropped to −2.8 °C, reflecting periodic nocturnal frost conditions typical for this time of year in northern climates. The relatively modest spread between minimum and maximum values suggests stable, though cool, air masses dominated.

Humidity levels were consistently high, with an average relative humidity of 89.9%, pointing to persistently moist air and frequent cloud cover. Atmospheric pressure averaged 1012.8 hPa, indicating predominantly stable but somewhat variable synoptic conditions, without prolonged strong high-pressure dominance.

Wind conditions were moderate. The average wind speed was 3.2 m/s, while the maximum wind gust reached 17.9 m/s, suggesting occasional passing low-pressure systems or frontal activity capable of producing short-lived stronger winds.


Rainfall Analysis

The total rainfall in March 2026 was 14.0 mm, which is relatively modest. When compared to typical January climatology (which generally exhibits higher precipitation totals in this region due to more frequent cyclonic activity), March appears drier and more stable.

Interannual comparison shows that March precipitation varies significantly:

  • 2024: 21.6 mm (notably wetter)
  • 2025: 4.2 mm (very dry)
  • 2026: 14.0 mm (moderate, near mid-range of recent years)

Thus, March 2026 can be classified as moderately dry, lacking both extreme precipitation events and prolonged dry spells.


Rainfall Comparison Chart (March Totals by Year)

YearRainfall (mm)
20220.0
20230.0
202421.6
20254.2
202614.0

In the context of recent years, 2026 stands out as intermediate, clearly wetter than the anomalously dry years (2022–2023, 2025) but not reaching the higher precipitation levels observed in 2024.


Overall Assessment

March 2026 exhibited typical late-winter to early-spring transitional characteristics, with cool temperatures, high humidity, and moderate wind conditions. The absence of extreme temperature fluctuations or major storm systems indicates a relatively stable atmospheric regime.

Precipitation levels were moderate and well within recent variability, reinforcing the impression of a climatologically unremarkable month. However, the persistently high humidity suggests that despite limited rainfall totals, cloudiness and damp conditions were frequent.

In summary, March 2026 can be described as a thermally cool, humid, and moderately dry transition month, aligning closely with expected seasonal patterns without significant anomalies.

[sv] Open post

Weather Summary of February 2026

Weather Analysis

This analysis was produced with the help of artificial intelligence, based on the weather data provided by the user.

February 2026 was a distinctly cold winter month, with a mean temperature of −8.2 °C. The maximum recorded temperature reached 3.1 °C, while the minimum temperature dropped to −19.8 °C, indicating persistent sub-zero conditions and several severe cold episodes.

Relative humidity remained high throughout the month, averaging 89.4 %, which is typical for winter periods dominated by cold, moisture-laden air masses.

The average air pressure was 1013.2 hPa, close to the long-term climatological mean, suggesting alternating influence of low- and high-pressure systems rather than a prolonged blocking regime.

Wind conditions were generally modest. The average wind speed was 1.82 m/s, while the maximum recorded wind gust reached 14.3 m/s. This indicates that although the month was largely calm, individual frontal passages produced short-lived stronger wind events.

Overall, February 2026 was characterized by stable cold conditions with limited thermal variability and occasional synoptic disturbances.

Rainfall Analysis

The total precipitation in February 2026 was 14.2 mm.

Compared to the historical February totals visible in the long-term dataset, February 2026 was drier than many recent years, especially when contrasted with notably wet Februaries such as 2016, 2020, and 2024. The total was clearly below several years exceeding 30–40 mm and substantially below the record-high February in 2024.

Climatologically, February precipitation tends to fluctuate considerably due to alternating snowfall events, mixed precipitation systems, and occasional Atlantic low-pressure intrusions. The relatively low total in 2026 suggests that the month was dominated by colder, more stable high-pressure intervals with fewer significant precipitation systems.

The chart above illustrates February precipitation totals by year, with 2026 annotated for clarity. The visual comparison highlights:

  • Strong interannual variability
  • Several exceptionally wet Februaries
  • February 2026 positioned in the lower half of the historical distribution

This confirms that February 2026 was moderately dry in a long-term context.

Overall Assessment

February 2026 was a cold and relatively dry winter month. Temperatures remained well below freezing on average, and severe cold spells pushed minimum values near −20 °C. Atmospheric pressure patterns suggest alternating synoptic systems, but precipitation activity was limited compared to wetter historical Februaries.

In summary:

  • Clearly colder than mild winter averages
  • Precipitation below many recent February totals
  • Calm to moderate wind regime
  • Meteorologically consistent with a stable Nordic winter pattern

The month can therefore be characterized as thermally severe but hydrologically subdued, reinforcing the winter season’s cold profile established earlier in the year.

[sv] Open post

Weather Summary of January 2026

Weather Analysis

This analysis was produced with the help of artificial intelligence, based on the weather data provided by the user.

January 2026 was distinctly cold, characterized by persistently sub-zero mean temperatures and limited precipitation.

The average temperature for the month was –5.99 °C, clearly indicative of a typically cold mid-winter regime. The maximum temperature reached 2.8 °C, representing brief thawing conditions, while the minimum temperature dropped to –15.7 °C, confirming the presence of pronounced cold spells during the month.

The average relative humidity was 91.5 %, reflecting moist winter air masses and frequent cloud cover.
Mean air pressure stood at 1016.3 hPa, suggesting predominantly stable synoptic conditions with intermittent high-pressure influence.

Wind conditions were generally moderate:

  • Average wind speed: 2.65 m/s
  • Maximum wind gust: 17.0 m/s

The strongest gust indicates at least one period of active weather, likely associated with a passing low-pressure system or frontal boundary.

Rainfall Analysis

The total precipitation in January 2026 was 16.0 mm.

When compared to the long-term January average (based on the station’s historical dataset), which is 27.6 mm, January 2026 was considerably drier than normal, receiving approximately:16.027.6≈58%\frac{16.0}{27.6} \approx 58\%27.616.0​≈58%

of the typical January rainfall.

This deficit suggests that high-pressure dominance and limited frontal activity likely restricted precipitation events. Given the cold temperature regime, much of the recorded precipitation likely fell as snow rather than rain.

The chart above illustrates total January precipitation totals across all available years in the dataset. January 2026 is marked for clarity.

Key observations:

  • January precipitation shows substantial interannual variability, ranging from near-zero totals to over 60 mm.
  • The 2026 total (16 mm) lies in the lower third of the historical range.
  • It is clearly below the climatological mean and significantly below the wettest January years on record.

This confirms that January 2026 was not only cold, but also relatively dry in a historical context.

Overall Assessment

January 2026 can be characterized as:

  • Cold overall, with sustained sub-zero conditions
  • Relatively dry, with rainfall well below the historical January average
  • Moderately windy at times, though not exceptionally stormy
  • Dominated by stable high-pressure periods, limiting precipitation

In summary, the month represented a classic northern winter pattern: prolonged cold conditions, high humidity, limited precipitation, and only occasional stronger wind events.

[sv] Scroll to top